Oslo Office Values Still Rising - Q4 2019
Office property in Oslo has been rising for all segments throughout 2019, and the growth is strongest for CBD assets with less than 5 years of remaining lease duration. This reflects the rising CBD office rents and a stable investor sentiment and financing side.
Akershus Eiendom has since 2010 published a set of indices for commercial property values. These indices are based on valuations of real and fictional office properties in the Oslo market.
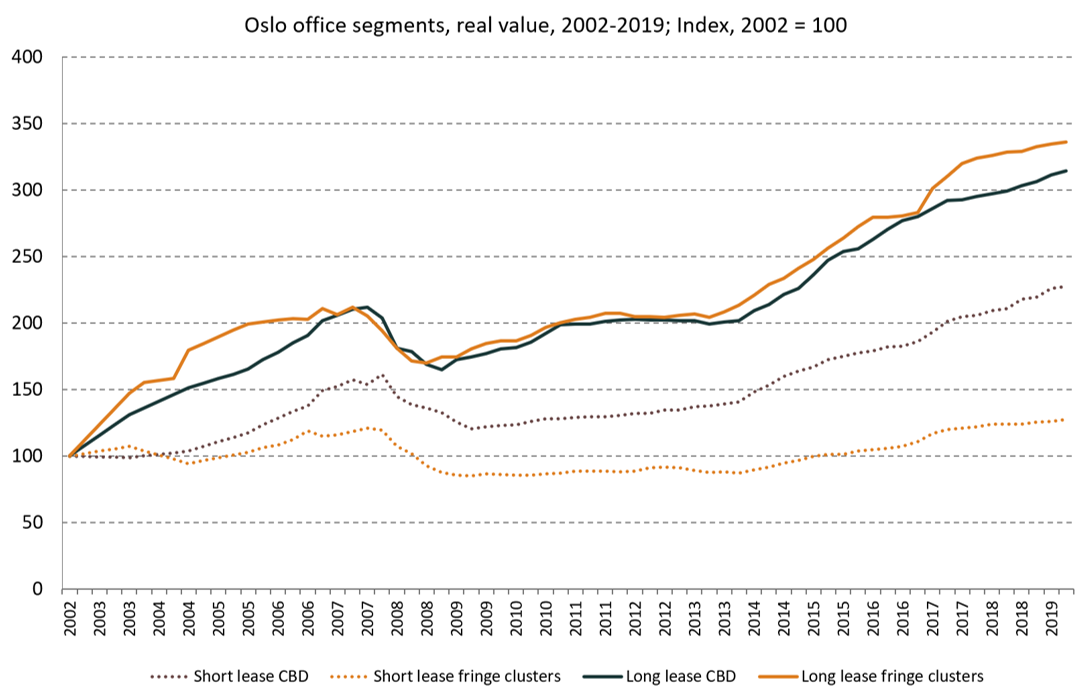
The index only covers the Oslo office market and gives the value for four distinct segments, shown in the graph, where “long lease” represents an office property with a 10-12 year lease with a solid tenant, and “short lease” represents an office property with 2-4 year remaining lease durations with solid tenants.
These are chosen to reflect two typical situations, of which the first is more exposed to changes in prime yield levels and the second is more exposed to changes in rent levels, as the short time until lease renewal will greatly affect the cash flow forecast.
The other two dimensions are CBD and fringe office cluster locations. By this, we choose “clean” locations, which means that all real and fictional properties included are in solid micro-locations within their areas, tailored to properly reflect the value development within the area.
The indices do not reflect any development or changes to the properties by tenant change, new leases, investments, or other specific events – they only reflect the change in market conditions caused by investor sentiment, which usually reflects lease market changes and financing situation changes.
The individual properties will follow the indexes for 1-2 years, after which the change in contract duration will usually also contribute to the change in value. A mixed portfolio is likely to follow a pattern of value growth between the long- and short-lease indices, assuming that the owner will do regular re-letting work along with minor investments when needed.

The Oslo office property market is currently benefiting from a slow, but steady rise in rents for high-standard properties all over the city, and for almost all properties in the city centre. This mostly affects the buildings with short-term leases, which are likely to have their cash flows improved as a direct result of this development.
As can be derived from the graph, the value growth has been strongest for the long-lease properties, and the decline in prime yield from 5.25% (in 2007 and again in 2011-13) to 3.75%. The indices then grow from 200 to above 300 in real terms in six years. The CBD short-lease properties also rise – in the CBD with about the same in percentage growth from 2013 to 2019 – while the fringe cluster location short-lease is at 130 in index value, compared to 100 in 2002 and 120 in 2007-8. This latter segment is competing directly with available land plots in these locations, which are abundant. We therefore consider this segment to be the last to experience strong growth.
The value growth has continued during 2019, as illustrated in the graph, with a nominal growth of 8% and 5%, respectively, for the CBD long- and short-lease segments. Fringe locations have seen value growth roughly equal to the CPI.
Our forecast for the next six months is positive for short-lease office property in general, and especially the CBD, while the long-lease assets may rise slower. The reason is the good outlook in rental development while we forecast the yields for long-lease property to be essentially flat, after the stabilization of long-term interest rates during later October 2019.